The Positioning — Newsflash #5

Week 5 · 13–20 March 2026W
eek 5 · 13–20 March 2026
Three portfolios. Same starting positions. Different decisions. Real money logic.
The Scoreboard
Portfolio | Value (USD) | Return | vs Last Week |
The Benchmark | $99,183 | -0.82% | -4.33pp ↓ |
The Algorithm | $98,911 | -0.91% | -3.79pp ↓ |
The Strategist | $98,219 | -1.78% | -4.99pp ↓ |
All three portfolios are now below $100,000. Five weeks in, nobody is winning. The thesis is being tested in the most direct way possible, not by macro noise or tariff headlines, but by a single stock that deteriorated in plain sight for seven days before it fell off a cliff.
What Happened
On Friday 13 March, Northern Star Resources (NST.AX) dropped 18% in a single session. The company released an operational update disclosing KCGM mill performance problems and a guidance cut, FY26 production revised to "above 1.50Moz," below prior guidance. It was the worst single day for NST in six years.
All three portfolios held NST going into that day. The Benchmark still holds it. The Algorithm and the Strategist had both added to the position the previous Monday on a DCA trigger. By Friday's close, NST was down 18% on the day and sitting well below the stop-loss threshold across all three accounts.
What happened next is where the three portfolios diverged and where this experiment produced its most instructive week yet.
The Signal Story
This is not a story about bad luck.
StackMotive had been firing sustained bearish CONVERGENCE alerts on NST every single day from 6 March, a full week before the crash. Price had dropped below SMA50. MACD histogram was deepening negative daily. By the evening of 12 March the night before the announcement, the platform had fired more than ten HIGH severity bearish CONVERGENCE alerts on NST in seven consecutive days.
The platform was doing its job. It built a persistent, data-driven case for caution over seven days while the company was publicly reporting record EBITDA and a growing dividend. The technicals and the fundamentals were telling completely different stories.
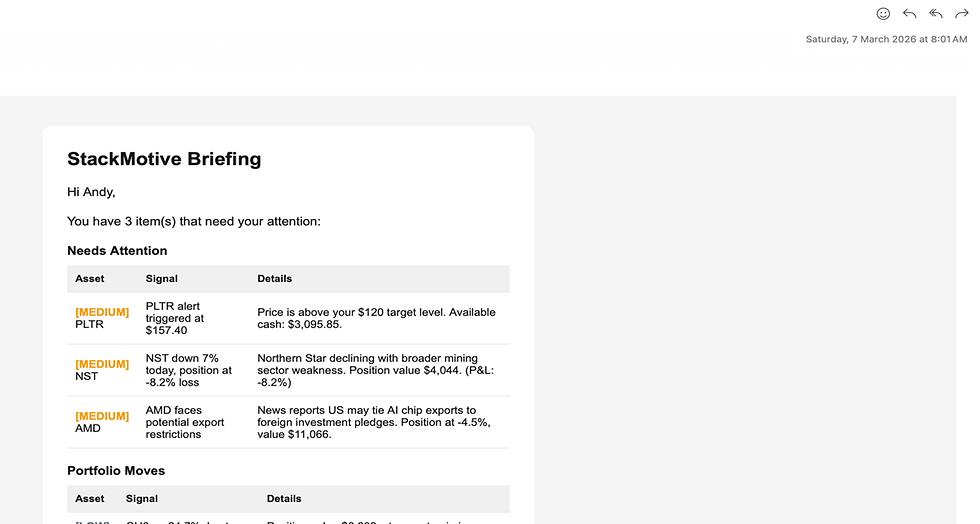
Saturday 7 March – the first warning. NST flagged as the portfolio’s biggest loser with no news catalyst.
On Monday 9 March, with three days of sustained bearish signals already on the record, the DCA trigger fired, price had declined 12% from average cost. The Strategist executed: added 53 shares at A$25.31. The rule said add. The broader signal context said caution. The human followed the rule and ignored the context.

Monday 9 March – the morning I bought more. The platform flagged NST as the biggest loser with no news explanation. I saw the DCA trigger and acted.

The signal stack behind the briefing. MACD bearish, price below SMA50, confluence building.
That was the first mistake.
The Crash Day — 13 March
The ASX announcement hit at 10:22am AEDT. By 11:06am, StackMotive had fired a STOP_LOSS alert — HIGH severity, across all three accounts. Current loss: -21.1% against an -18% threshold.

Friday 13 March, 8:04am – two hours before ASX announcement. The platform was already flagging NST as overweight and down 26%. The stop-loss fired at 11:06am
For the Algorithm, the STOP_LOSS fired simultaneously with another DCA_TRIGGER. Two conflicting signals at the same moment. In that situation the system's logic held: stop-loss takes precedence. But the execution logs show the Algorithm did not exit NST on crash day. It held. The CYL stop-loss three days later it executed cleanly and immediately. NST it did not. I'm still investigating why, and I'll report back in Newsflash #6 when I have a clear answer.
For the Strategist, the STOP_LOSS alert fired at 00:06 UTC. At 03:51 UTC, less than four hours later, I dismissed it. My note in the system: "Dismissed — decided I wanted to buy more instead."
I then added 66 shares of NST at A$21.97 and 92 shares of CYL at A$6.32. Both on DCA triggers. Both within twelve minutes of each other.
I didn't know about the announcement when I made those trades. I saw the DCA signal, I saw the price had fallen, and I acted. The stop-loss alert was sitting right there in the same interface. I dismissed it and bought more of the thing it was telling me to exit.
Here's the honest reason why: I wasn't paying attention. I've spent the past several weeks heads-down building StackMotive — the platform generating these very signals, and I was treating the alerts as a to-do list to clear rather than intelligence to act on. I saw the DCA trigger. I didn't sit with the full signal picture. I dismissed the stop-loss the way you dismiss a notification you don't have time to read properly.
The platform was doing its job. I wasn't doing mine.

Where the NST position sits today. This is what ignoring seven days of warnings looks like.
The CYL Divergence
Three days later, on 16 March, CYL hit its stop-loss threshold, down 20.2% against a -20% trigger.
The Algorithm executed immediately and automatically: full exit, 370 shares at A$6.01. No hesitation, no second-guessing. Proceeds: A$2,223.
I exited manually thirty-three minutes later: 462.5 shares at A$6.13. I had added 92.5 shares on crash day, which is why my exit quantity was larger. Proceeds: A$2,835.
The Benchmark held. It still holds CYL today at -25.4%.

Sunday 15 March — both NST and CYL flagged HIGH simultaneously. CYL's stop-loss would fire the following day.
Three different outcomes from the same signal on the same position. The Algorithm acted on the rule the moment it fired. I acted half an hour later, having stared at it long enough to decide the rule was right. The Benchmark never saw the alert, never made a decision, and is sitting on the larger unrealised loss.
Which of those three approaches is correct? I genuinely don't know yet. CYL may recover. NST may recover. The Benchmark's passive indifference may turn out to be wisdom rather than inertia. We don't have enough data to know.
What I do know is that the Algorithm behaved exactly as designed. One clean exit when the rule triggered. That's what this week was built to test, and it passed.
NST — Where It Stands
I still hold NST. 332 shares at a blended average cost well above current price. The position is sitting at -41% P&L. The platform is still firing daily bearish CONVERGENCE alerts. RSI has been below 30 for days. MACD histogram is deeply negative and not recovering.
The debasement thesis on gold miners hasn't changed. KCGM's operational problems are real but the expansion timeline for FY27 remains intact according to management. That's my rationale for holding.
Whether that rationale is sound or whether I'm simply rationalising a bad position because I don't want to crystallise the loss, I can't answer that honestly yet. That's the question Newsflash #6 will have to address.

The current signal picture on NST. The platform hasn’t changed its view
The Benchmark holds NST too. It has no choice, it never acts. The difference is that the Benchmark's inaction is by design. Mine is a decision I'm accountable for.
The Five-Week Arc
Week | Benchmark | Strategist | Algorithm | Leader |
Week 1 | -0.10% | -1.00% | -0.84% | Benchmark |
Week 2 | +0.21% | -0.47% | -0.37% | Benchmark |
Week 3 | +2.97% | +3.03% | +2.11% | Strategist |
Week 4 | +3.51% | +3.21% | +2.88% | Benchmark |
Week 5 | -0.82% | -1.78% | -0.91% | Benchmark |
The Benchmark has led four of five weeks. The Strategist led for exactly one week. The Algorithm has never led, but this week it came closest, and it did so by executing a rule without flinching while the human in the loop was distracted.
Five weeks of active management have produced a portfolio worth $965 less than doing nothing. That's not catastrophic. It's not vindicated either. It's just the honest number.
What I'm Watching
NST is the only story that matters right now. The position is large, the loss is significant, and the signals have not turned. I need to make a clear-eyed decision about whether I'm holding on thesis or holding on hope. Those are different things, and I owe it to this experiment, and to you all, to be honest about which one it is.
That decision, and its outcome, is Newsflash #6.
The Positioning tracks model portfolios for educational purposes. This is not financial advice. I hold positions in everything discussed here. All figures in USD at current exchange rates. Do your own research.


Comments