The Positioning — Newsflash #6

Week 5 · 20–28 March 2026W
eek 5 · 13–20 March 2026
Three portfolios. Same starting positions. Different decisions. Real money logic.
The Scoreboard

Six weeks in. All three portfolios negative. The gap between the best and worst performer is 92 basis points — the tightest it’s been since Week 1. The market has done what markets do when uncertainty is high: it’s punished everything roughly equally and made active management look redundant.
The NST Decision
I ended Newsflash #5 with a question I owed you an answer to: am I holding NST on thesis or holding it on hope?
The answer is thesis.

The daily briefing that kept arriving this week. Every morning, NST in the needs-attention section. Every morning, the same decision to hold
NST is at A$18.55 this week, up from A$17.25 last week. Still deeply underwater from my blended average cost. Still sitting at -36.88% P&L. The platform is still firing bearish signals. None of that has changed.
What hasn’t changed either is the underlying case for Northern Star. NST has been a sound operator for years. The KCGM mill problems are real, I’m not pretending otherwise, but the expansion timeline for FY27 remains intact according to management. This is an operational setback, not a structural failure. The debasement thesis that brought NST into the portfolio in the first place — gold as a hard asset in a world of expanding money supply and deteriorating fiscal positions, is if anything stronger now than when I bought.
The arithmetic hasn’t changed. Central banks across the developed world expanded M2 money supply at approximately 7-8% annually through the last decade. Official CPI runs at 2-3%. The gap between those two numbers is not a rounding error, it is a slow, steady transfer of purchasing power from savers to debtors, from the patient to the leveraged. Gold miners are not a speculative bet. They are an operational exposure to the one asset class that has preserved purchasing power across centuries of monetary experimentation. NST’s mill problems are real. The monetary backdrop is structural. I am not confusing the two.
I’m holding. That’s the decision. I’ll be wrong or I’ll be right, and Newsflash #7 will tell us which direction it’s moving.

The position as it stands. 332 shares. -36.88%. Still held
The Benchmark is also holding NST. It has no choice. The difference, as always, is that its inaction is by design and mine is a considered call. Whether those two things produce different outcomes over time is exactly what this experiment is built to measure.
Closing the Loop — The Algorithm and NST
In Newsflash #5 I flagged an open question: why didn’t the Algorithm exit NST when the stop-loss fired on 13 March?
Short answer: it was broken. Auto-execution had a bug that was silently preventing any execution. It was fixed and deployed on 16 March — the CYL stop-loss exit was the first clean auto-execution after the fix went live. NST’s stop-loss fired three days before the fix. The Algorithm never had a chance to act on it.
It’s fixed now. Moving on.
What the Algorithm Did This Week
The Algorithm made its first bullish auto-trade since reinstatement, adding 8.4 shares of AMD at $220.27 on a bullish CONFLUENCE signal. Score +5.25. MACD bullish, price above SMA50 and SMA200, institutional flow positive. The system saw a strong signal and acted on it automatically, exactly as designed.
The Strategist made the same trade, 8.4 shares of AMD, nine hours later at $204.49. Nearly $16 cheaper per share.
That gap wasn’t skill. It was luck. I happened to execute later in the session when the price had pulled back. The signal was the same. The logic was the same. The outcome was marginally better for the Strategist through timing alone, not judgement.
I’m documenting it honestly because the experiment requires it. A lucky outcome isn’t a vindication of discretion.

The AMD position. The 8.3 share add this week is pending blend into the displayed ave cost – the position reflects the original 56 shares at entry. The add was executed at $204.49, below the Algorithm’s $220.27
The Strategist — My Week
Two trades and a pattern worth noting.
AMD — ADD 8.4 shares at $204.49 (26 March)
Same bullish confluence signal the Algorithm acted on. I saw the signal, I agreed with it, I executed. No drama.
TLX — TRIM 81.5 shares at A$13.65 (27 March)
TLX has been one of the portfolio’s strongest performers — up 33.95% from entry. It breached its allocation ceiling, triggering a rebalance alert. I acted on it, trimming back toward target weight and banking some of the gain into cash.
Then there’s CCJ. The platform flagged a DCA approaching signal on CCJ three separate times this week. I dismissed all three. Why did I act on the TLX rebalance but ignore the CCJ DCA approaching alerts? I can’t give you a fully satisfying answer. CCJ is down -8% and approaching a level where the rules say I should be preparing to add. I dismissed it each time. That’s the honest record.
The gap between what the rules say and what I actually do remains the most interesting variable in this experiment.

The full trade record. Six weeks of decisions in one frame.
The Benchmark — Still Doing Nothing, Still Competitive
No trades. No decisions. No alerts reviewed. The Benchmark holds everything, including NST at -36.88%, CYL at -20.32%, and TSLA at -13.23%. It’s carrying every losing position without flinching because it doesn’t know they’re losing.
At -1.77% it’s the best performing portfolio for the fifth time in six weeks. The most passive approach continues to produce the best results.
I keep writing that sentence because it keeps being true. At some point the experiment has to grapple with what it means.
The Six-Week Arc

The Benchmark has led four of six weeks. The Strategist led once. And this week, for the first time, the Algorithm led, by the narrowest of margins, but it led. The same week it made its first autonomous bullish trade, it produced the best return of the three. That’s worth noting, even if one week proves nothing.
*Real return = nominal return minus weekly equivalent of 7.5% annual monetary expansion (0.14%/week). Six weeks of “doing nothing” has returned approximately +3.34% nominally. In real purchasing power terms, accounting for monetary expansion, that figure is closer to +2.50%. Still the best result. But the gap between the number on the statement and what it’s actually worth is already visible, and that’s six weeks, not twenty years.
Six weeks of active management have cost the Strategist $915 versus the Benchmark. Six weeks of automated signal execution have cost the Algorithm $304 versus the Benchmark. Neither approach has outperformed doing nothing.
The question the next few weeks will have to answer: is this a market environment problem or a strategy problem? The portfolios are built around a debasement thesis — hard assets, gold miners, select tech. That thesis hasn’t changed. But in a week where broad market uncertainty is compressing everything, thesis-driven portfolios and passive portfolios look identical. The divergence — if it comes — will come when the thesis starts to differentiate.
What I’m Watching
NST. Still. The position has stabilised but the signals haven’t turned bullish. Every morning the briefing arrives with NST in the needs-attention section. I read it. I hold.
Gold is doing what the thesis said it would. The macro backdrop — sticky inflation, rate cut expectations pushed out, fiscal positions deteriorating across the developed world — is exactly the environment this portfolio was built for. The gold miner exposure is the right place to be. NST’s operational problems are the wrong stock to express it through, at least for now.
The AMD add gives both the Strategist and the Algorithm some exposure to a potential AI infrastructure recovery. If the broader tech selloff finds a floor, AMD is positioned to benefit.
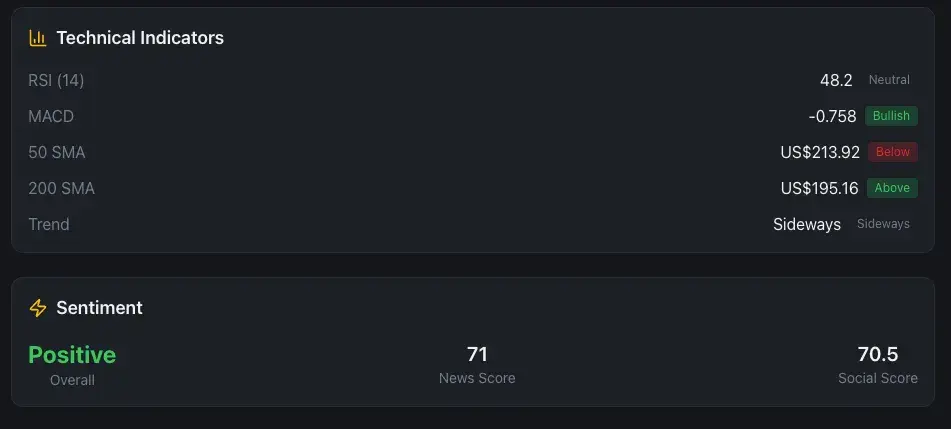
AMD’s current signal picture. Sentiment positive despite near-term technical weakness, he case for the add.
The next divergence point will be whether the Algorithm’s autonomous execution starts to compound an edge — or whether it keeps tracking the Benchmark closely while the Strategist makes occasional discretionary calls that may or may not add value.
Six weeks. Still no clear answer. That’s the honest position.
Every signal in this experiment, the Convergence alerts on NST, the stop-loss that fired on CYL, the AMD confluence trigger, the daily briefing that kept arriving each morning with NST in the needs-attention section, has been generated by StackMotive.
For six weeks this newsletter has been, without naming it directly, a live demonstration of what the platform does. Three portfolios. Real money. Real signals. No cherry-picking.
StackMotive opens to investors on 15 April 2026.
It is not a brokerage. It does not execute trades. It is the intelligence layer that sits alongside whatever platform you already use, Sharesies, Hatch, Interactive Brokers — and watches your positions the way a research desk watches its book. When something institutional-grade happens to a stock you hold, you hear about it. What you do next is your decision.
If the last six weeks have been useful, that’s the next step.
The Positioning tracks model portfolios for educational purposes. This is not financial advice. I hold positions in everything discussed here. All figures in USD at current exchange rates. Do your own research.

Comments